Performance Summary
Past performance is not a reliable indicator of future performance
Source: Internal CI data reports, December 31, 2025
Inception Date: 5 December 2016
*Annualised
$100k Invested Since Inception (net)
Past performance is not a reliable indicator of future performance
Source: Internal CI data reports, December 31, 2025
Risk/Return Since Inception (Per Annum)
Quarterly Highlights
- The Fund returned 0.6% for the quarter and 3.9% for the year.¹
- The top performers for the quarter were Games Workshop (GAW), Royalty Pharma (RPRX) and Investor AB (INVE.B).
- The detractors to performance were RELX (REL) and Motorola (MSI).
- The one-year return was generated by the Protect side of the Fund with Franco Nevada (FNV) (Gold Royalties), Royalty Pharma (RPRX) (Biopharma Royalties), Ferrovial (FER) (Toll Roads), Investor AB (INVE.B) (Investment Holding Co) top contributors to returns.
- Since inception, the strategy has generated an 8.4% pa net return with 75% downside capture of markets.¹
¹ Past performance is not a reliable indicator of future performance.
Portfolio Insights & Market Observations
The Global Endowment Strategy continues to focus on generating attractive risk-adjusted returns with an emphasis on capital preservation. Global markets have performed above long-term averages with the MSCI ACWI index returning 68% in local currency over the last three years. Much of this performance has been concentrated in large cap technology and semiconductor stocks.
It is important to note that the earnings per share have grown 18% in the same three-year period, with multiple expansion contributing to nearly 40% to the return, with the remainder being dividend income. Following this significant re-rating of earnings, valuation multiples are elevated. The MSCI ACWI trades on a one-year forward PE of 21x and the S&P500 trades on a further premium at 23x earnings. Oaktree Capital’s Howard Marks notes that across 27 years of observations, today’s valuations are in the top decile. At this level, forward returns for investors over the next decade have always been close to zero.
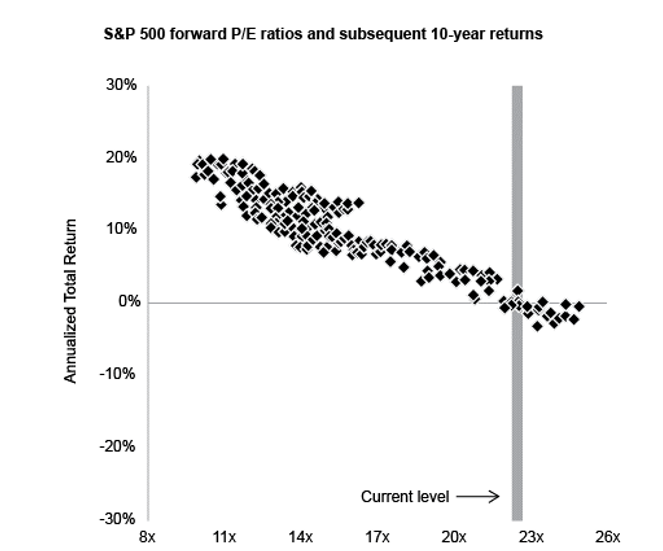
Source: Oaktree Capital (2025). On Bubble Watch: available at: https://www.oaktreecapital.com/insights/memo/on-bubble-watch. Accessed 20 December 2025. Note: Retrieved from J.P. Morgan Asset Management
The portfolio is well placed to weather lower forward returns via the “Protect” portion, which now accounts for over 50% of the Fund.
This category is invested in four different business models:
- Real Assets ranging from toll roads, data centres, cell towers, midstream pipelines, railroads, water utilities. These are asset-backed, highly cash-generative businesses with structurally inflation-protected revenue streams and strong balance sheets.
- Royalties of pharmaceutical, gold, oil and mineral titles. Scaled royalty businesses are high-margin, low-capital intensity structures with upside optionality from undeveloped or yet to be commercialised assets.
- Idiosyncratic assets owned include physical uranium, exchanges and special situation investments. The performance of the businesses should be determined by their specific opportunity set and not by market forces.
- Holding companies are a collection of diversified portfolios of quality businesses managed by thoughtful and long-tenured capital allocators that presently trade at a discount to their Net Asset Value.
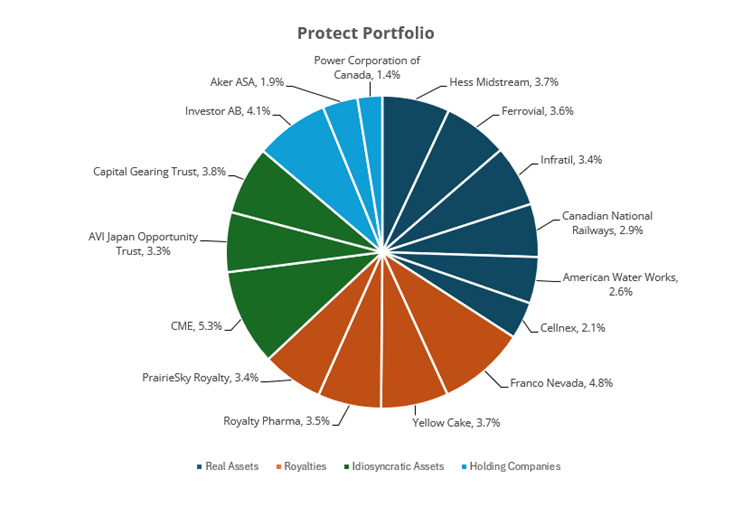
Source: Internal CI data reports, as at 31 December 2025
Our collection of unique companies boasts exceptionally strong balance sheets, particularly when measured against their underlying assets or industry norms. They generate a collective dividend yield of circa 3% that we expect to grow in-line with their earnings power over time.
Fundamental to our stock selection is a focus on highly competent, well-incentivised management teams. Combining this with the unique cash generating nature of our collection of businesses, these highly skilled teams can create even more value through their capital allocation. We see further latency in how they can invest incremental cashflows to generate future growth and in that absence return large amounts of cash back to us as shareholders.
An example of this is with Cellnex (CLNX) the leading cell tower operator in Europe. Having learned from the errors of a previous management team, Cellnex have now halted expansion plans and have committed to optimising costs and returning significant cash back to shareholders. In contrast, Royalty Pharma (RPRX) see ample opportunity to invest in biopharma royalty assets at attractive prices, and we are pleased that they continue to do so.
Our bias for high-margin, highly cash generative, well-defended businesses has remained unchanged. Though we argue not all “quality” companies are created equal, and some deserve the de-rate and others do not, we are not immune to the “quality” factor underperformance. In particular, the “Grow” portion of the Fund has underperformed meaningfully, largely from valuation, not underlying earnings power declines. Over this period, the “Protect” portion has picked up the slack and delivered better returns. Whilst both remain important, “Protect” has and will continue to play a major role in achieving the Fund’s risk and return objectives.
Portfolio Snapshot
Past performance is not a reliable indicator of future performance
Source: Internal CI data reports, December 31, 2025
| name | region | subset |
|---|---|---|
| CME Group Inc. Class A | North America | Stalwarts |
| Taiwan Semiconductor Manufacturing Co., Ltd. | Asia | Stalwarts |
| Hess Midstream LP Class A | North America | Bond like Equities |
| Visa Inc. Class A | North America | Stalwarts |
| Franco-Nevada Corporation | North America | Asset Plays |
Regional Exposure
Subsets of Value
Market Capitalisation
Since Inception Net Returns in Up/Down Markets
Portfolio & Risk Metrics
| Portfolio | Benchmark | |
|---|---|---|
| Price/Earnings | ||
| Yield | ||
| Price/Book | ||
| Net Debt to Equity | ||
| FCF Yield FS | ||
| Forecast Earnings Growth | ||
| Return on Equity | ||
| Tracking Error | ||
| Beta |
Further Information
Looking for further information regarding the Fund, please don’t hesitate to get in touch: