Performance Summary
Past performance is not a reliable indicator of future performance
Source: Internal CI data reports, March 31, 2026
Inception Date: 1 December 2004. Initially, the Fund invested predominately in Australian equities. However since May 2006, the Fund has been invested in a broad range of global equities. With effect from 1 October 2020, the benchmark changed to the MSCI ACWI 100% Hedged to AUD Net Dividends (previously MSCI AC World net dividends in local currency).
*Annualised
The portfolio returned -6.7% for the quarter. For the financial year to date the portfolio has returned -7.7%.¹

¹Past performance is not a reliable indicator of future performance.
Portfolio Observations
We use our Capital Pools framework to categorise and compare investment opportunities, as well as construct the portfolio. Each capital pool is quite distinct with different risk and return attributes and performs differently under various market conditions or economic backdrops. This allows us to diversify the Fund through different sources of return (and risk).
Compounding Capital Pool
These are the “generals” of the portfolio - companies with clearly defined customer propositions, observable growth runways backed by industry tailwinds, attractive financial models and run by aligned management teams with deep domain expertise. Investment returns are earned as the businesses execute on multi-year strategies, driving growth in sustainable Free Cash Flow per share and hence a “compounding” of shareholder value.
For most of the last decade these sorts of investments have been an attractive hunting ground for listed market investors. The archetypal compounders are capital-light, such as software or data vendors, marketplaces and services businesses. This capital-light element effectively supercharges the compounding potential.
Over the last six months there has been an acceleration in the capabilities of AI beyond the familiar “chat bot” use case, particularly in the domains of coding and “agentic” applications. This has placed significant doubt on the terminal values of many of these capital-light business models.
As described by Founder and Executive Chairman Pat Ryan on the 2025 Q4 earnings call, "What distinguishes this cycle is simple. It was harder for longer on the way up and much faster on the way down, particularly as it relates to property." Pat went on to share that in more than 60 years in the industry he has rarely witnessed market sentiment shift this rapidly. We also failed to recognise how quickly the cycle was turning — or more directly, we failed to at least reduce the size of the investment as the operating environment was clearly softening. Ryan Specialty's competitive position remains strong, and management continue to invest countercyclically in talent and technology. However, given the continuing weakness in end markets, we have materially reduced the size of our investment.
Reversionary Capital Pool
Real Assets Capital Pool
The result of this combined sell-off has been a poor outcome for the traditionally structured 60:40 portfolios. As the FT article states “the combined moves have put a traditional “60-40” portfolio of equities and bonds on track for the worst month since September 2022, when a previous cycle of global interest rate rises hammered markets. Even gold has tumbled as investors rush to liquidate previously winning trades, underscoring a lack of safe havens in financial markets.”

This has forced investors to seek alternatives sources of diversification to a traditional bond allocation, which is the focus of AQR’s article, opining that most of the suggested alternatives (Private Credit, Buffer Funds and Bitcoin) are poor alternatives as they have very high levels of volatility.
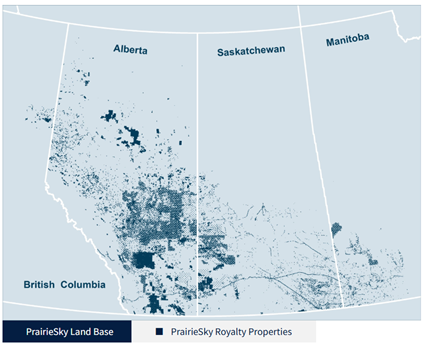
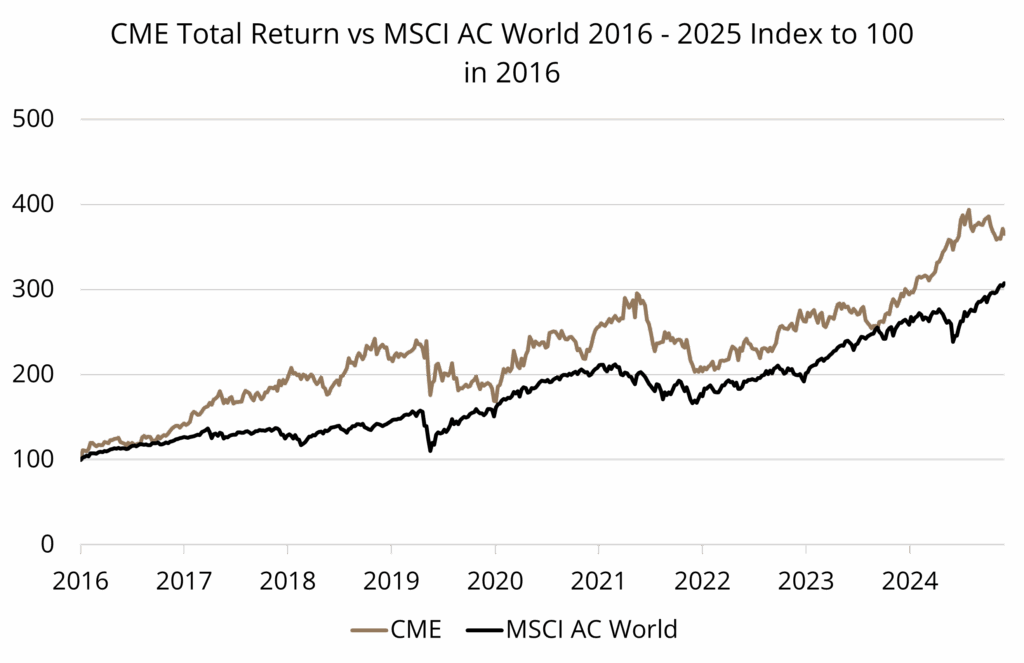
We think the key to identifying an effective alternative is to understand why the relationship has broken. The driver of this unwinding has been inflation. This can be hedged by real assets, for example the Fund’s holdings in PrairieSky Royalty (PSK) (a perpetual energy royalty owner over significant lands in the Western Canadian Sedimentary Basin (see Appendix 1)) and CME Group (the largest global derivatives exchange operator – an effective royalty on financial speculation, hedging and asset inflation (see Appendix 2)).
To further drive home the point, the correlation of bonds with equities started increased along with inflation in 2022, at which time the correlation of CME and PrairieSky started to decline.
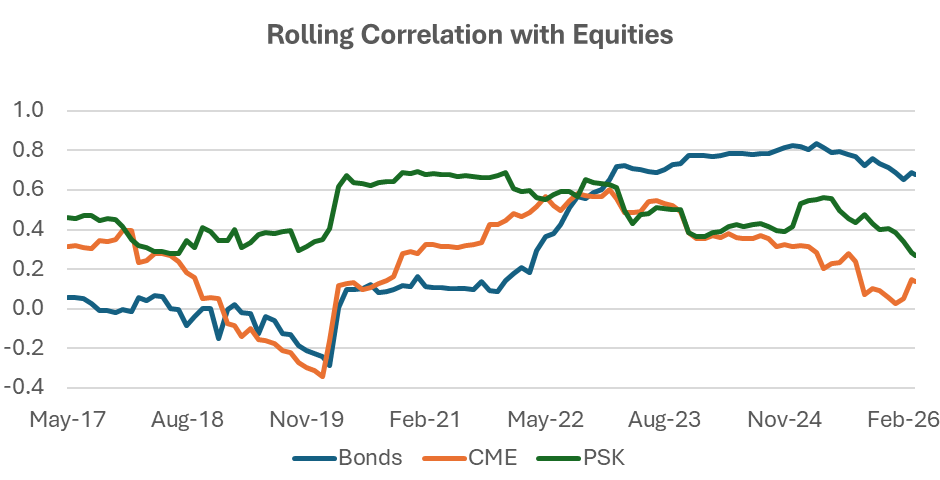
Source: CI Analysis, FactSet. Bonds is a 50/50 split of US/International Aggregates. Equities = MSCI AC World. Analysis uses Total Returns.
²Stocks and bonds slump in tandem as Iran shock leaves investors ‘nowhere to hide’ FT 28 March 2026
³A Positive Stock-Bond Correlation Is a Terrible Reason to Add More Equity Risk to Your Portfolio AQR 8 April 2026
Appendices
Appendix 1
“Time is the enemy of a bad business, but a friend of a great business. As time melts away, dividends are paid, the business grows and the share count declines”. – Andrew Phillips, CEO of Prairie Sky Royalty
- Deep technical skills: they understand the most attractive resource opportunities, where the hidden and emergent value lies.
- Intuitive understanding of value creation: a deep, intuitive understanding of the option value that drives royalty value.
- First principles thinking: spend most of their time alone studying, charting their course for which they are laser focused.
- Patient, counter cyclical investing: able to behave counter-cyclically; being patient for long periods and then moving aggressively when opportunity present (we would suggest it’s hard to achieve this without also demonstrating the first three).
Equally important was how Andrew relentlessly set about creating an ownership culture – recruiting people to the organisation who embraced this mindset (and removing those who didn’t). Today, all managers, directors and employees own shares in the company.

At the 2025 Investor Day in May, PSK provided an update on the value of their royalty asset base. This value, albeit undiscounted, stands at circa C$30B as compared to PSK’s current Enterprise Value of less than C$6B.
²Please note that this is a forecast only, based upon Cooper Investors’ current views and assumptions, and is not guaranteed to occur. Any forecast may differ materially from the results ultimately achieved.
Appendix 2
Focused Management Behaviour
- Interest Rates – US Treasuries, SOFR, Fed Funds
- Equities – S&P 500
- Foreign Exchange – JPY/EUR/GBP-USD
- Energy – WTI Crude, Henry Hub
- Agriculture – Corn, Wheat, Soybeans, Livestock
- Metals – Gold, Silver, Platinum, Copper, Aluminium
- Crypto – Bitcoin, Ethereum
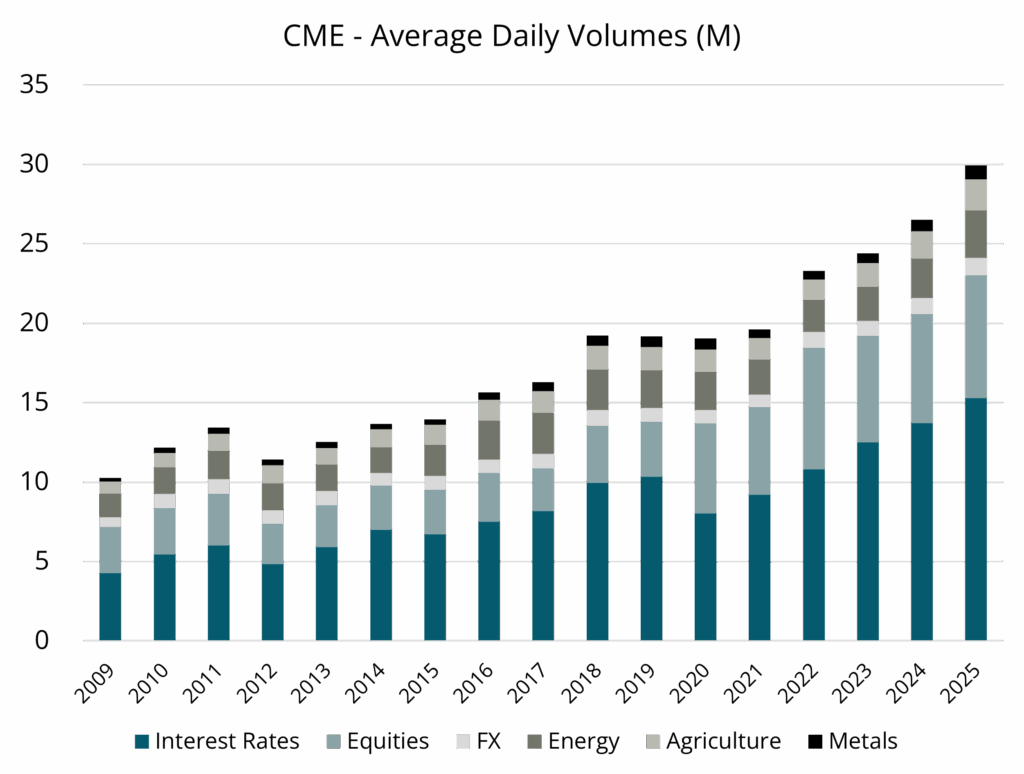
more important are the fundamental economics of exchanges. Often described as “liquidity begets liquidity” where the network effect is strongest. The tightest bid-ask spreads exist where there are the greatest number of buyers and sellers. This encourages more traders to participate, driving up liquidity, and so on. In conjunction with the regulatory requirement for central clearing (the central management of contract settlement) which is also managed by CME, we can see all the hallmarks of a dominant and functional monopoly that also benefits customers by reducing trading costs.
Latency then stems from inevitable bouts of volatility which we note that in the current geopolitical and macroeconomic environment can be rapid, violent and frequent.
Portfolio Snapshot
Past performance is not a reliable indicator of future performance
Source: Internal CI data reports, March 31, 2026
Regional Exposure
Capital Pools
Sector Exposure
Market Capitalisation
Further Information
Looking for further information regarding the Fund, please don’t hesitate to get in touch: