Performance Summary
Past performance is not a reliable indicator of future performance
Source: Internal CI data reports, December 31, 2025
Inception Date: 1 December 2004. Initially, the Fund invested predominately in Australian equities. However since May 2006, the Fund has been invested in a broad range of global equities. With effect from 1 October 2020, the benchmark changed to the MSCI ACWI 100% Hedged to AUD Net Dividends (previously MSCI AC World net dividends in local currency).
*Annualised
$100k Invested Since Inception (net)
Past performance is not a reliable indicator of future performance
Source: Internal CI data reports, December 31, 2025
Risk/Return Since Inception (Per Annum)
Performance Commentary
The portfolio returned -2.5% for the quarter. For the calendar year 2025, the portfolio returned 6.2%. This quarter caps off a remarkable three years for global equities markets over which period the Fund returned 12.0% on an annualised basis1.
Over this same three-year period, the MSCI ACWI 100% Hedged to AUD annualised return is 19.7%. These gains have not been evenly distributed – the largest 10 companies in the index have accounted for 40% of the benchmark’s performance. For context, the equal weighted index has returned 12.7% per annum over the same three-year period.
Much has been written about the potential risks of this concentration effect and so we will not belabour the point here only to counsel investors against expecting persistent mid-teens (or higher) returns – history, and a wealth of academic studies, suggests a realistic market return expectation is close to 9-10% over rolling 5-10-year periods.
To be clear, over the long-term we are seeking to deliver you, after all fees, a risk-adjusted return above that over the market. Given we are seeking to achieve this by running an index-unaware portfolio structure, portfolio returns may differ materially from the index over shorter time periods.
¹Past performance is not a reliable indicator of future performance.
Contributors to Performance
The largest positive contributors to Fund returns over the past 12 months were our holdings in TKO Holdings (TKO) and Taiwan Semiconductor Manufacturing Company (TSMC).
TKO Holdings
TKO Holdings (TKO) is the owner and operator of the two leading combat sports content assets – the UFC and WWE. We wrote about TKO in our September 2024 Quarterly Report and provided updates in our June 2025 and September 2025 Quarterly Reports.
We have been investors in TKO for a little over one year over which time the share price has appreciated over 80%. Our investment proposition is based on the increased demand for sports media rights from traditional broadcasters/cable as well as global streaming platforms (Netflix, YouTube, Amazon, Apple). These media companies see live sport as crucial to maintain and grow viewer numbers and/or subscribers. Given the year-round volume and flexibility of both the WWE and UFC, TKO’s assets are well positioned to benefit from this trend. In addition, TKO benefits from a powerful flywheel where in addition to media rights, it monetises its content via sponsorships (e.g. Monster Energy on the Octagon) and live events (with site fees paid by local governments and ticket sales).
Over the past year, TKO has renewed most of its important media deals (US UFC and WWE Premium Events) at rates well above previous deals. In addition, management continues to grow its sponsorship business, signing several new multi-year deals which we expect to become increasingly lucrative as the UFC’s and WWE’s growing exposure (via Paramount+ and Netflix respectively) becomes more of a factor.
Going forward, we believe there are still meaningful areas of latency across the business including international UFC media rights which are roughly a third the size of the US rights despite 80% of the fanbase residing outside of the US.
In addition, we are now starting to see TKO’s Zuffa Boxing venture take shape. Boxing as a sport has a rich heritage; however, for several decades the fragmented administration and promotion of the sport has resulted in an erosion in the quality of the spectacle. TKO’s approach will be to replicate the UFC’s model using a stable of “ranked” fighters who move up the rankings based on performance. The best will fight the best. Although it will take time, the long-term prize is significant – for example, the Canelo-Crawford super-fight shown on Netflix in September (also promoted by TKO) drew 41 million viewers, upwards of 10-15x UFC’s typical (albeit growing) audiences.
“What [boxing] has that the UFC didn’t have is you need to be educated on the UFC, you need to understand how the sport works, MMA, grappling, karate, jujitsu, boxing, all that goes into it. Boxing, everybody gets. It’s been around for 100 years. It’s a gladiator sport one of the three biggest sports as far back as the roaring twenties…so we think there is enormous runway once it’s run the way it should be run.” – TKO COO Mark Shapiro
We remain enthusiastic shareholders and are looking forward to attending UFC 325 in Sydney in February.
Taiwan Semiconductor Manufacturing Company
Taiwan Semiconductor Manufacturing Company (TSMC) is the world’s largest semiconductor foundry. The Fund has been invested in TSMC since May 2020. Over this period, the company has cemented its position as the leading manufacturer of advanced chips and delivered Earnings per Share growth of close to 30% per annum. Investment returns have been over 36% on an annualised basis. More recent growth has been fuelled by the demand for chips used in High-Performance Computing applications, or AI.
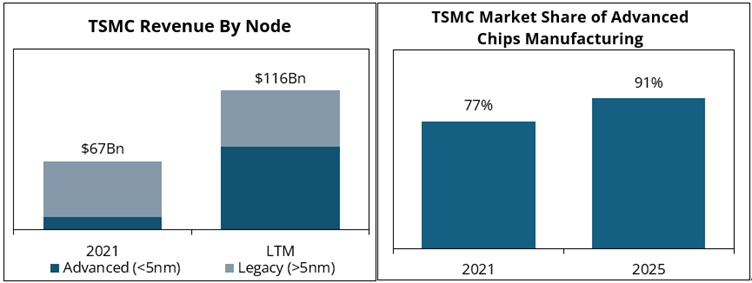
Source: Counterpoint Research, Company Filings, CI Analysis
History shows that the long-term winners from significant technology shifts such as AI are difficult to predict. Our approach instead is to observe the industry trends and invest where we perceive the most attractive risk-adjusted returns. In this case, semiconductor proliferation (across AI and other markets) as well as the increasing complexities in the semiconductor manufacturing processes place TSMC in an increasingly important position. Put simply, TSMC have a near-monopoly position in the manufacture of leading-edge chips and so will thrive for as long as the semiconductor industry continues to push the performance envelope. This is a bet we are willing to make. We expect TSMC’s earnings growth to remain in the low-20% p.a. range; an outcome which is not captured in the current share price.
Detractors from Performance
The largest detractors from fund performance over the last year were Ryan Specialty Group (RYAN) and freee K.K.(freee).
Ryan Specialty Group
We wrote about wholesale insurance broker Ryan Specialty (RYAN) in our December 2024 Quarterly Report. The business is currently navigating a soft underlying insurance pricing environment predominantly in the property portion of the business. Even in this softer environment, we expect RYAN to grow its 2025 revenues organically at close to 10% and EBITDA at over 20% when taking into account completed acquisitions.
By way of background, as an insurance broker RYAN’s revenues are generated as a percentage commission applied to the insurance premiums they help to place. Therefore, insurance pricing has a direct short-term impact on revenues. However, over the long term, insurance volumes are the most important driver of revenue growth. On this front, flows into the Excess and Surplus market, which is RYAN’s focus, remain at a robust double-digit growth rate. Management continues to execute at a high level – introducing new products and integrating acquisitions as exemplified by the company’s 15% organic revenue growth in the third quarter, which is several-fold faster than the broader insurance broker peer group.
We were most impressed with management’s decision to increase investment counter-cyclically, a move we believe will pay-off handsomely for long-term shareholders.
“As the industry reacts to a transitioning market, we are attracting more talented professionals that are looking for a platform that not only withstands market cycles, but powers through them. Over the last 15 years, we built a culture and business model that stands apart from our competitors. Throughout the quarter, we saw a significant opportunity to ramp up our recruitment efforts. As a result, we added a significant number of experienced professionals to our world-class team.” – Ryan Speciality Executive Chairman and Founder, Pat Ryan.
We have used the share price weakness to add to our investment.
freee K.K.
freee K.K. is a Japanese software company primarily focused on providing accounting and HR-related tools to small businesses and sole proprietors. We have been following and meeting the company since 2019, prior to its eventual IPO in 2020.
Today we see a de-risked opportunity – freee’s best-of-breed cloud offering has achieved 10% market share, continues to grow revenues above 20% p.a., and the business has now reached a scale such that it is sustainably cash flow positive. Freee’s existing product suite and distribution strategy will support continued penetration of the enormous market opportunity ahead, as Japanese businesses are increasingly forced to adopt technology-led productivity solutions as an offset to meaningful demographic headwinds. This revenue growth is expected to flow with very strong incremental margins driving meaningful uplift in overall firm profitability. In just three years, we believe freee should be generating circa ¥11B in Free Cash Flow².
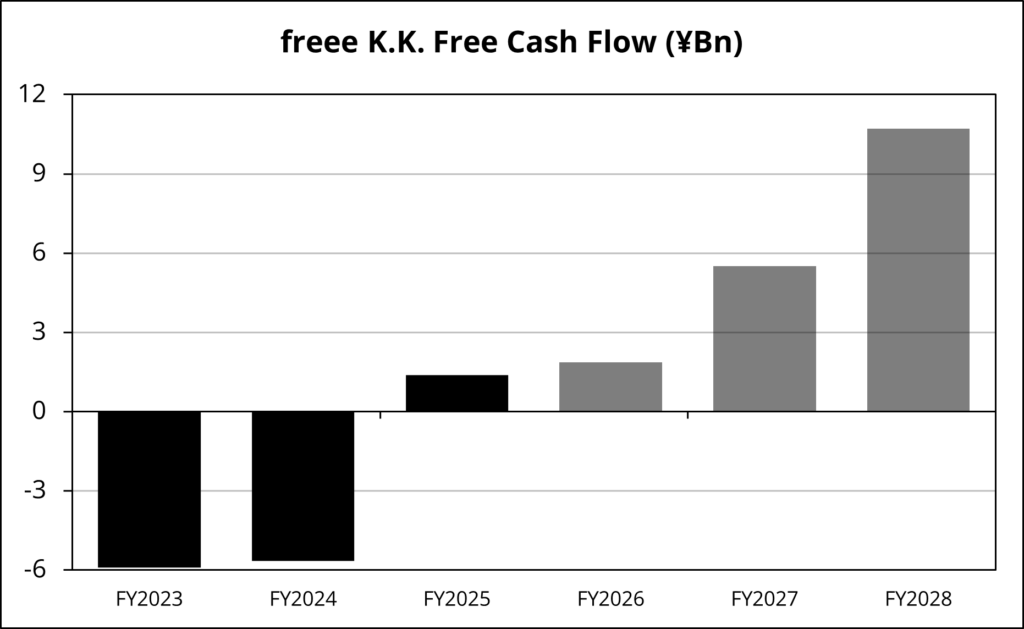
Source: Company Reports, CI Internal Analysis
When compared to today’s ¥160B Enterprise Value, we can only conclude that the shares are very cheap. There is a material growth runway beyond 2028. The market seems overly fixated on short-term profits, which has provided the opportunity for us to build our investment. We visited the co-founders and senior management team in Tokyo in mid-December where the meetings supported our analysis.
2Please note that references to FCF growth are a forecast only, based upon Cooper Investors’ current views and assumptions, and is not guaranteed to occur. Any forecast may differ materially from the results ultimately achieved.
Industry Observation
The portfolio currently holds investments in two sports content assets – TKO Holdings (TKO) and Liberty Formula One (FWONK). We have outlined below our summary analysis of a key value driver for these content assets.
Searching for Latent Sports Talent
The Talent Pipeline Problem
WNBA star Caitlin Clark is a unique talent, being the only player in US college basketball history to lead in both scoring and assists for four consecutive seasons. And when she entered the WNBA for her rookie season the world took notice – viewership on ESPN increased 170%3 as fans watched Clark set rookie records in scoring, three-pointers made and assists.
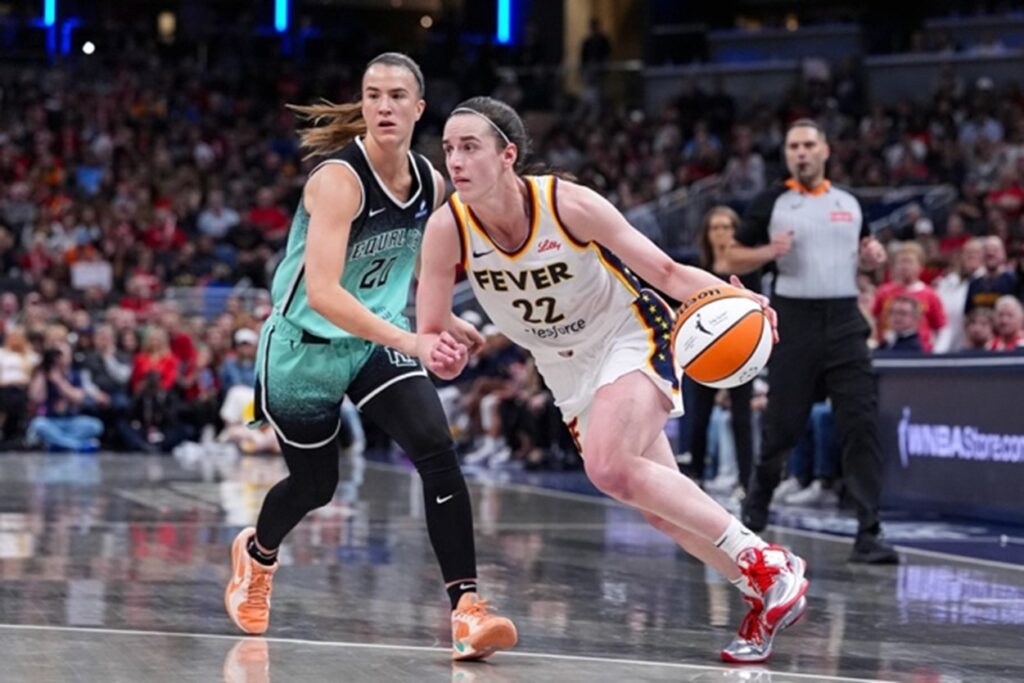
Indiana Fever Star Caitlin Clark
Source: AP News
The “Caitlin Clark Effect” highlights a key aspect of sports content assets. Sports assets like all content assets are about driving audience engagement and monetising that engagement. Sports engagement is driven by an exciting spectacle and captivating stars. Caitlin Clark is a rare talent that unlocks both: her talent takes the spectacle to another level, bringing in new fans.
But the challenge faced by emerging sports is how to create stars like Caitlin Clark? Two current examples highlight the scale of the challenge:
Formula 1 has sought to grow in the US, with some success, driven partly by Netflix's Drive to Survive series showcasing both the racing spectacle and the paddock stars. However, it has been held back by the absence of US stars; US fans want to cheer for a US driver competing for a world championship. But building these stars takes a generation or more, as they need to develop a talent development pathway, attract juniors and then develop this young talent from grass roots level karting through to the professional level.
Similarly, in Australia the AFLW (women's AFL league) consists of many athletes who did not grow up playing the sport; it will take a generation for current junior teams to build that talent through the ranks. This highlights the talent pipeline problem: it's very long and unpredictable.
A de-risked pathway of creating stars and raising the spectacle is converting latent talent from other competitions and adjacent sports. For example, the UFC was able to tap into significant combat talent (wrestling and martial arts) around the world. This included several former Olympic and collegiate athletes (Ronda Rousey, Randy Couture and Brock Lesnar) who were drawn to the superior opportunities for fame and fortune that the UFC offered compared to their existing competitions.
We believe there is a latent US talent pool ready to light up another Fund holding, Liberty Formula One, and specifically the recently acquired MotoGP.
3WNBA, (2024). WNBA Delivers Record-Setting 2024 Season. WNBA. 28 September 2024. Available at: https://www.wnba.com/news/wnba-delivers-recordsetting-2024-season [Accessed: 14 August 2025].
MotoGP and the American Opportunity
"Growing in America is our main goal [for MotoGP]." — Dorna (MotoGP) chief Carmelo Ezpeleta
Earlier this year, Liberty Media announced it had completed the acquisition of MotoGP, meaning the company behind Formula 1's transformation now owns the world's premier motorcycle racing series.
Liberty is seeking to execute their F1 playbook: accelerating growth markets, growing the casual fan base and improving monetisation. The US represents one of their most important growth markets. But as we've established, achieving meaningful success in any market requires world-class local talent. We believe substantial latent US motorcycle talent exists that could produce the stars needed to drive the sport's growth in the US over the next decade.
The Latent Talent
The United States has a deep legacy of motorcycle racing talent built on decades of world-class success, a strong domestic racing culture, and widespread early exposure through motocross, flat track, and club racing. American riders like Kenny Roberts (pictured), Nicky Hayden, and Ben Spies once dominated the global stage, creating a legacy that continues inspiring young talent today.
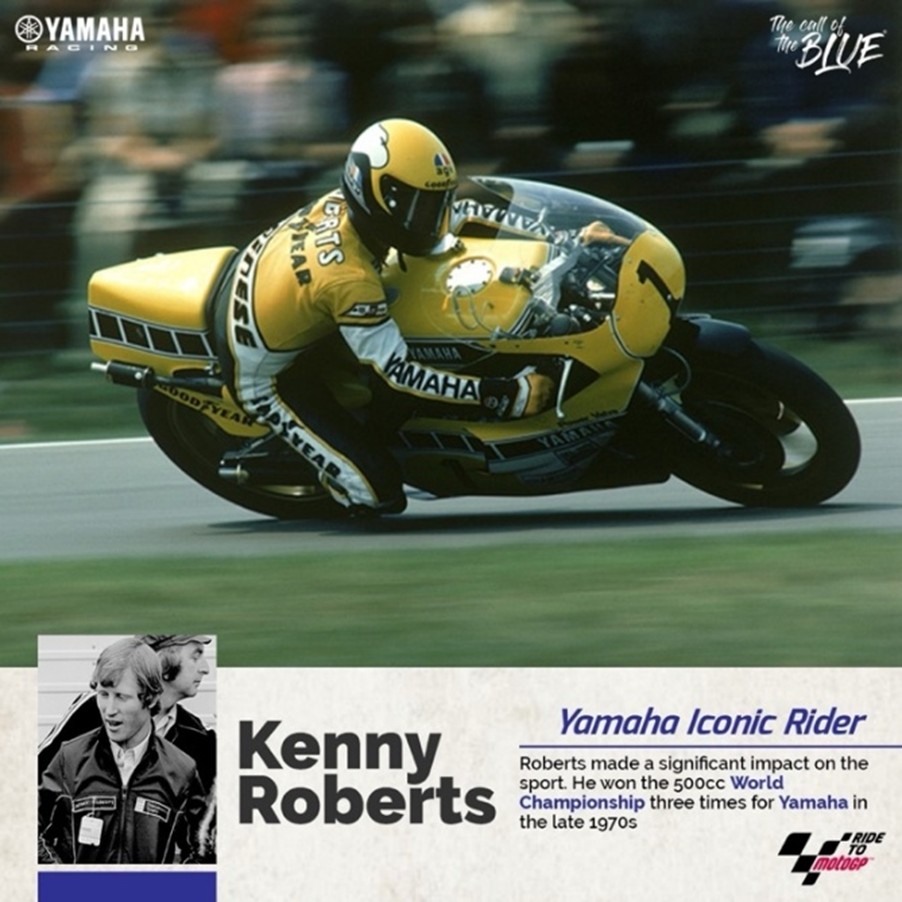
Legendary US motorcycle rider Kenny Roberts
Source: Yamaha Nepal
The US’s local motorcycle racing series, MotoAmerica, has been revitalised in recent years and now provides a clear national platform with a comprehensive development ladder (aligned to MotoGP rider development). Liberty will accelerate this development, and we believe this will lead to a stable of US riders competing for a world championship, creating engagement in the US market leading to increased monetisation for Liberty.
The Opportunity
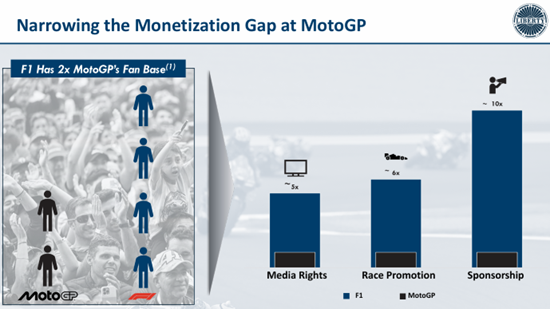
“F1's audience in both race attendance and cumulative TV viewership is roughly double that of MotoGP, yet F1 monetises its primary revenue streams at roughly 5 to 10x [MotoGP]” – Derek Chang, Liberty Media CEO
Currently, America hosts just one of 22 annual MotoGP events, and the broader Americas accounts for only 4% of MotoGP's media rights revenue. The growth potential is enormous – achieving 40% of Europe’s media rights would create ~$1.5 billion4 of value, which would represent around 1/3 of the purchase price.
In addition to the US latency, many racing enthusiasts describe MotoGP as the most exciting spectacle in motor racing due to the intensity of the competition, leading to lots of overtaking and being less prone to dominance compared to Formula 1. But monetisation is still nascent in many key areas:
MotoGP in total earns revenues of around 25% of Formula 1
It is still dominated by Europe (83% of media rights)
Sponsorship is still dominated by motorcycle-related companies (~75% of total) and
Venues are further away from demand centres (think Phillip Island in Victoria versus Albert Park in Melbourne), making it harder to attend and attract casual fans.
Source: Company Reports
This provides significant latency for us, as Liberty Media shareholders.
4Assuming 85% incremental margins and a 15x FCF multiple
Outlook
As discussed in the opening paragraphs of this letter, equities markets have delivered exceptionally strong returns in recent years. A consequence of this performance is that the market (as represented by the MSCI AC World) now trades on a Free Cash Flow multiple higher than any level of the last 20 years. Further, the concentrated nature of the market’s performance means that there are pockets of the investment universe which today exhibit extreme valuations (and risks).
Our investment approach typically takes a three-to-five-year time horizon when assessing a company’s prospects. We expect on average, investment returns will follow a similar time horizon, at least at the aggregate portfolio level. Sometimes we get paid earlier (see TKO above) and sometimes we have to be patient and lean into the opportunity (see RYAN/freee above).
Given the market backdrop, we have refreshed well over half of the portfolio into new investments over the last year. As we look at the individual names in the portfolio today, we have very high conviction that our individual investments (TKO, TSMC, RYAN, freee, FWONK and the rest!) have material levels of upside (value latency). All the holdings also display high levels of operational momentum that makes us confident that they will deliver investors risk adjusted returns that are both superior and differentiated to the broader market over the medium term.
Portfolio Snapshot
Past performance is not a reliable indicator of future performance
Source: Internal CI data reports, December 31, 2025
Regional Exposure
Capital Pools
Sector Exposure
Market Capitalisation
Since Inception Net Returns in Up/Down Markets
Portfolio & Risk Metrics
| Portfolio | Benchmark | |
|---|---|---|
| Price/Earnings | ||
| Yield | ||
| Price/Book | ||
| Net Debt to Equity | ||
| FCF Yield FS | ||
| Forecast Earnings Growth | ||
| Return on Equity | ||
| Tracking Error | ||
| Beta |
Further Information
Looking for further information regarding the Fund, please don’t hesitate to get in touch: