Performance Summary
Past performance is not a reliable indicator of future performance
Source: Internal CI data reports, December 31, 2025
MSCI AC World is the Fund’s Benchmark, MSCI Midcap is a reference benchmark.
Inception Date: 2 July 2019
*Annualised
$100k Invested Since Inception (net)
Past performance is not a reliable indicator of future performance
Source: Internal CI data reports, December 31, 2025
Risk/Return Since Inception (Per Annum)
Quarterly Highlights
- The Fund returned -0.16% for the quarter. Since inception the Fund has returned 8.21% pa.¹
- The top contributors were Royalty Pharma (RPRX), Power Corp (POW) and Investor AB (INVE).
- The largest detractors were Brown & Brown (BRO) and News Corp (NWSA).
- Currency was a drag to returns as the AUD increased.
1 Past performance is not a reliable indicator of future performance.
Portfolio Insights & Market Observation
The prior trends continued in that the Real Assets capital pool delivered strong returns, but were offset by weak performance from the Compounders pool. For the quarter, Real Assets were up 3% whilst Compounders was -3%, offsetting the gains in Real Assets.
Over the last year, the Real Assets capital pool has delivered a 20% return. Top contributors were Aker Asa (AKER), Royalty Pharma (RPRX) and Power Corp (POW). Aker grew its NAV by 15% in 2025 and paid an 8% dividend yield. Royalty Pharma continues to grow its royalty receipts double digits whilst streamlining its corporate structure in 2025. Power Corp core holdings in wealth and insurance are growing earnings double digits, minority investments saw material valuation uplifts and at the same time paying a 4% dividend yield and buying back shares.
The Real Assets Pool has averaged 34% of the fund weighted over the last year. Over 3 years, the Fund’s Real Assets capital pool allocation is up 75% cumulative, and since inception is up 129% cumulative or 13.5% pa (gross).
Compounders have been a different story. Performance of the Fund’s Compounder companies has been weak, returning -10% over 1 year, 25% cumulative over 3 years and 75% cumulative since inception (gross). The soft performance has been broad and not attributable to one stock or industry group.
This is surprising to us. Over the long term, we expect the Compounders pool to deliver returns at least equal to, if not higher than, the Real Assets pool given the nature of their businesses, lower capital intensity, and higher returns on capital which should lead to higher growth. What explains the anomaly?
For context, we looked externally to what has happened to family and founder-led businesses more broadly. Over a 20-year period, the global index MSCI ACWI has compounded earnings at close to 4% and paid dividends of 2.6% per annum. The UBS Family Index, which tracks 500 listed family-owned businesses for comparison, has grown earnings at circa 8% CAGR and paid a 2.5% dividend yield over the same 20 years with less volatility.
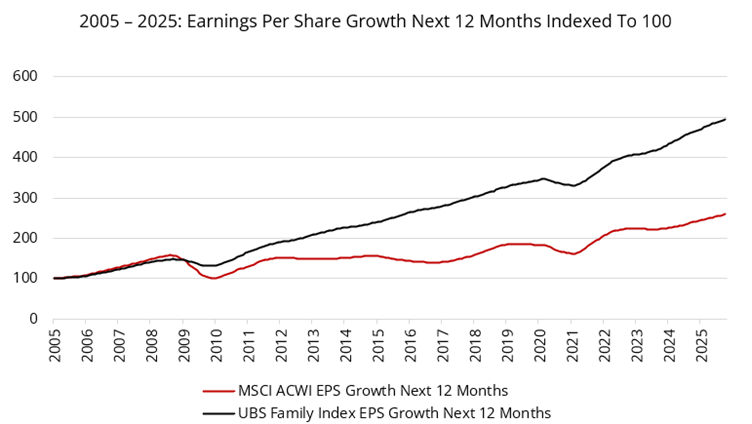
Source: FactSet
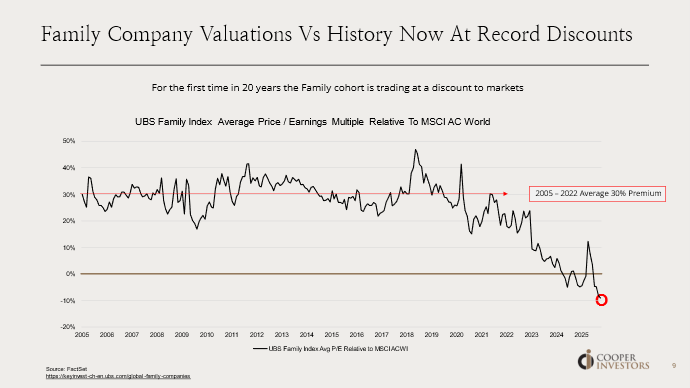
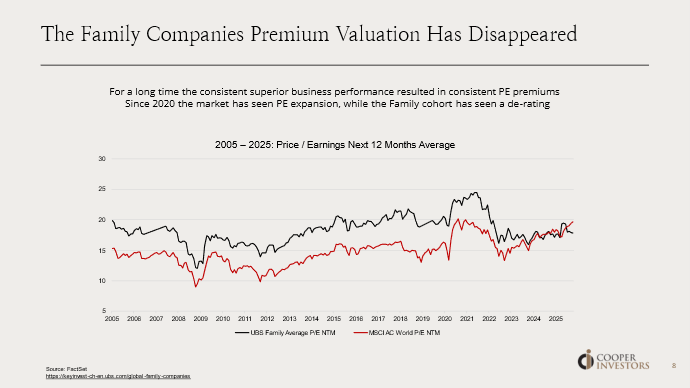
This superior consistency of business performance historically resulted in a persistent valuation premium to the broader market. This group of exceptionally run companies traded on circa 30% premiums for two decades, oscillating between 20% and 40%. Since 2023, and for the first time in 20 years, this premium to the market has evaporated, and now stands at a discount. Many family businesses have de-rated whilst the rest of the market has become substantially more expensive.
In analysing our portfolio in the above market context, we observe the Fund’s Compounders have experienced this same dynamic; they have continued to grow their earnings and now trade at a discount to market multiples. We expect the Fund’s Compounder Pool to grow earnings and cash flows in the teens pa over the next 3 years2.
We think there is ample opportunity in both the Compounders and Real Assets capital pools; lesser loved, exceptional Compounder companies that have been forgotten for new shiny companies. Consistent double-digit earnings growers in insurance brokerage, vertical software, and biopharma testing trade on well below market multiples. This group sits alongside holding companies trading at an average of 25% discount to their NAVs. Given the opportunity set, the Fund is split evenly between Compounders and Real Assets, and we see significant latency across both pools.
2 This forecast is based upon Cooper Investors’ current views and assumptions and is not guaranteed to occur. Any forecast may differ materially from the results ultimately achieved.
Observations From The Road
This quarter we crossed the pond and spent time in both North America and Europe, meeting numerous portfolio holdings, operators, competitors and new potential ideas.
We caught up with Brookfield Corporation (BN), a core holding since the Fund’s inception. Brookfield is entering its next phase of evolution. Twenty years ago, Brookfield was investing in and operating assets from its own balance sheet. Over the years, they added an asset management arm, managing assets for others. Brookfield Asset Management is now a $90bn market cap listed company in which Brookfield Corp owns ~70%.
The latest evolution was the addition of an insurance business. When interest rates were low, returns for insurance operations were depressed and Brookfield was able to enter the industry with value purchases. They saw an opportunity to enter the market and become an investment-led insurer. Their approach is to write low-risk liabilities (mostly annuities) and invest to capture a yield spread. This business is now approaching a $2bn profit pool.
Brookfield are evolving once more in their insurance business. The spread income business is to look a little more like Berkshire Hathaway - instead of capturing a spread, the “float” is to be invested in real assets. Infrastructure, renewables and real estate investments (well within their circle of competence) will replace credit instruments as the investment of choice. If executed successfully, the value of compounding this float at higher rates of returns can drive significant upside from $100bn investable portfolio that is continuously growing. Though the strategy will take a few years to implement, once humming, we expect it will drive significant value creation.
We also spent time in Sweden where the Fund has owned Investor AB (INVE.B) for over two years. Investor AB is the investment holding company for the Wallenberg family and foundation. Investor AB is the controlling shareholder in global leaders like Atlas Copco, ABB, SAAB and many more. Key to investing in holding companies are earnings and NAV growth. Investor AB’s collection of businesses are exposed to inevitable industry trends such as robotics, electrification and defence and are well placed to drive growth. Over time, the company has also built up a portfolio of privately held healthcare businesses. The largest is Mölnlycke, acquired in 2007, a global leader in advanced wound care products such as high-end dressings with over EUR2bn of revenues. This wholly owned portfolio of businesses has both operational and valuation upside as healthcare businesses become desirable again.
Sweden is a ripe hunting ground for family and investment holding companies. The country’s investment holding companies have proven to be an exemplar of long-term focus, and performance culture without the drawbacks of excess or at the expense of minority shareholders. We’ve also observed the rise and development of the “serial acquirer industry” where skilled capital allocators will regularly and selectively make value creating acquisitions, optimise and redeploy into further acquisitions. We met with a number of these (both established and emerging) as well as the authors of the highly recommended book “The Compounders: From Small Acquisitions to Giant Shareholder Returns”.
These business models are often backed by a founder or controlling shareholder that acquires EUR1-10m profit businesses that are transitioning from a family business. By paying reasonable prices (circa 4-7x EBIT), and growing organically, a number of these “serial acquirers” have delivered consistent mid-teens earnings growth over long stretches of time. We continue to follow this cluster closely and are patiently waiting for opportunities to own them at the right price.
Whilst not everything goes to plan, our companies are largely executing in line with expectations. Earnings continue to grow double digits in steady industries such as healthcare, insurance brokerage, wealth management, vertical software, niche industrials and services. These are areas with inevitable demand and owners that can execute on the opportunity organically and inorganically. This has not resulted in the commensurate portfolio returns; as previously mentioned the Compounder pool has faced a de-rating in a market that’s been heavily re-rated. The Fund trades on 18x PE today and is growing earnings in the teens. This multiple is in line with the ASX 200 and below all other major indices such as S&P 500, MSCI AC, etc despite all the superior qualitative and quantitative characteristics. In response we are seeing buybacks increase, with nearly two thirds of the portfolio holdings buying back shares in 2025. Importantly we have invested in families and founders we trust to do the right thing and who on average own 25% of the companies. We believe this will drive superior business performance over the long term. Our holdings are significantly undervalued, and we remain fully confident this will eventuate into portfolio returns.
Portfolio Snapshot
Past performance is not a reliable indicator of future performance
Source: Internal CI data reports, December 31, 2025
Top 10 Fund Holdings
| Name | Name |
|---|---|
| Brookfield Corp | Constellation Software Inc. |
| Royalty Pharma | Brown & Brown |
| Ferrovial SE | D'leteren Group |
| L E Lundbergforetagen AB Class B | EXOR N.V. |
| Liberty Media Corporation Series C Liberty Formula One | Power Corporation of Canada |
Regional Exposure
Sector Exposure
Since Inception Net Returns in Up/Down Markets
Portfolio & Risk Metrics
| Portfolio | Benchmark | |
|---|---|---|
| Price/Earnings | ||
| Yield | ||
| Price/Book | ||
| Net Debt to Equity | ||
| FCF Yield FS | ||
| Forecast Earnings Growth | ||
| Return on Equity | ||
| Tracking Error | ||
| Beta |
Further Information
Looking for further information regarding the Fund, please don’t hesitate to get in touch: