Performance Summary
Past performance is not a reliable indicator of future performance
Source: Internal CI data reports, December 31, 2025
Inception Date: 1 July 2004
*Annualised
$100k Invested Since Inception (net)
Past performance is not a reliable indicator of future performance
Source: Internal CI data reports, December 31, 2025
Risk/Return Since Inception (Per Annum)
“Language disguises thought.” Ludwing Wittgenstein
Quarterly Highlights
The CI Brunswick Fund returned 4.13%1 for the December 2025 quarter net of fees and expenses, compared to -1.01% for the ASX200 Accumulation Index. Contributors to portfolio performance in the period were Regis Healthcare (REG), Aspen Group (APZ) and Ryman Healthcare (RYM). Stocks that underperformed include Newscorp (NWSA), Guzman y Gomez (GYG) and Infratil (IFT).
¹ Past performance is not a reliable indicator of future performance.
Portfolio Insights & Market Observations
There has been a lot written about the big theme of AI – how will it impact jobs and companies? Who will be the winners and losers? Is it a revolution or bubble? We won’t add to the speculation, but we continue to observe shifts in sentiment at a stock and sector level which could provide opportunities. As examples, marketplace businesses – companies like Carsales (CAR) and REA (61% owned by Newscorp (NWSA)) on the ASX and their offshore equivalents, as well as software businesses domestic and offshore, have experienced material deratings more recently. This reflects the view that the new LLMs (large language models) will alter competitive dynamics in these sectors. For incumbent software companies, this could manifest in lower entry barriers through cheaper software development. For leading online marketplaces, LLMs could raise substitution risk through new forms of search and discovery.
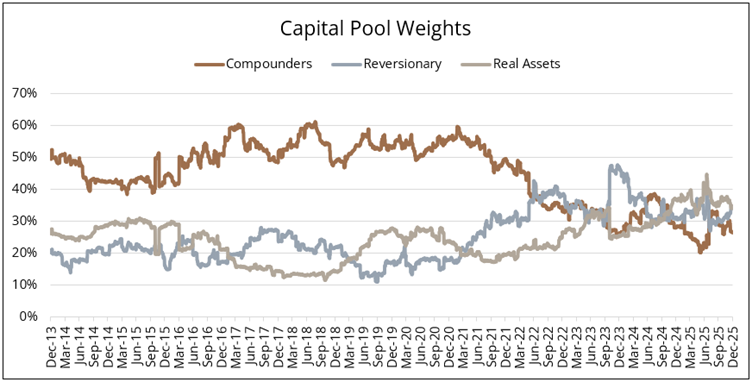
In recent years, we have found it challenging finding stocks with attractive VoF attributes in our Compounding capital pool, mostly in our ability to find latent value. Relative to history (particularly pre-COVID history), our allocation to this capital pool remains well below average:
Chart 1: Capital Pool Weights over time

Source: Internal CI data reports, as at 31 December 2025
Given the recent deratings of these growth/Compounding stocks, we have increased our focus and work in this area. However, in the past, changes in market sentiment around big themes like AI can cause significant market volatility, one aspect of what we refer to as the ‘hubris to humility’ cycle. What happens if there is a more material market sell-off from here?
The Brunswick Fund’s over-riding mindset is the “tortoise over the hare”, which means you can expect the Fund to underperform as markets become frothier. However, over its 21+ year history, the Brunswick Fund has demonstrated strong risk attributes:
- The long-term beta of the Fund is less than 0.8x, meaning we have taken effectively 80% market risk;
- The Fund’s volatility (variation in the Fund’s net asset value) over time, has typically been below the ASX200;
- The Fund’s outperformance has come from performing better (on average) in months when the ASX200 falls.
At present, consensus (i.e. median) analyst expectations (sourced from Factset) for each of the Fund’s stocks, weighted based on the stock’s % of the portfolio, suggests the “look-though” earnings of the Fund is expected to grow by ~15% p.a. over the next few years1. Our view is this should underpin growth in value (capital return and capital growth). While a growing economy is helpful, many of the Fund’s stocks are pegged to trends that are less dependent on broader growth:
Affordable housing. This is a huge problem in Australia and due to its multi-faceted nature (high costs of land, materials, labour and taxes), is very difficult to solve. Aspen Group (APZ) remains exceptionally well placed as one of the few able to serve this large segment of the market while still delivering strong returns for shareholders. Aspen was again, one of the strongest contributors to the Fund’s returns in the quarter.
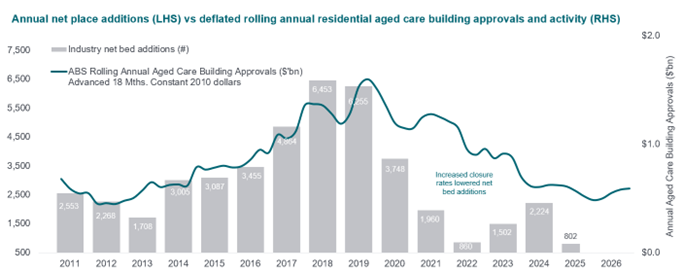
Ageing demographics. At present, the Fund’s biggest exposure to this trend is via accommodation providers, particularly Aged Care, which has both robust demand in the 80+ year old segment, with very weak supply growth for the last 5 years. As shown in the chart below, there were only 802 net bed additions to the sector in FY25 despite a requirement for an additional ~10k beds p.a. to meet the demands of the ageing population.
Chart 1: Net bed additions in Aged Care in Australia

Source: Ord Minnett
In the prior quarter, we highlighted Regis Healthcare (REG) as a key underperformer for the Fund. However, in this quarter REG was a key outperformer with around a third of the September underperformance reverting. One reason the stock has become more volatile is it’s on the cusp of inclusion in the ASX200. With the rise of passive funds, events like this have become a more significant driver of short-term share price movements. Given the supply /demand setup supporting the industry, we continue to think REG will be a strong performer for the Fund over the medium term.
New Zealand economic recovery. We have highlighted this opportunity in previous quarterly reports – NZ has suffered a more severe downturn vs Australia over the past couple of years. The RBNZ raised interest rates to a level higher than the RBA and has since cut rates by more than 300bps. Despite the cuts, the NZ economy is only now showing signs of green shoots. The Fund has multiple exposures to a recovery in NZ, including Ryman Healthcare (RYM), which was another key performer for the Fund during the quarter. We expect Ryman will benefit not only from a NZ recovery, but also from the demographic tailwinds highlighted above.
During the quarter, we added Cellnex (CLNX) to the portfolio. CLNX is the largest European owner and operator of mobile phone towers and sits in our Real Assets and Income Securities capital pool. A product of many mergers over the last decade, CLNX in recent years became overgeared with capital commitments resulting in minimal cash returned to shareholders. However, our work identified CLNX being close to inflection point for generating and returning significant cashflow. We like the setup where a high-quality infrastructure asset pivots away from a high capex and gearing phase, as there is potential for mispricing where market perception lags reality. The CLNX Board and management team have already de-geared the balance sheet and publicly committed to material shareholder returns, both dividends and buybacks.
As a mostly duopoly operator, CLNX cashflows are highly certain with very long-term contracts and high incremental ROIC (return on invested capital) either through yearly escalators or when mobile operators are added to an existing tower asset. We also believe there is medium-term latency for CLNX’s customer base (European telcos), who historically have struggled to realise price increases and therefore have underinvested in their networks. Data usage for mobile end customers continues to grow at a rapid rate and has resilient, non-discretionary characteristics. Finally, like other high-quality infrastructure assets, long-term maintenance capex for mobile tower operators is not significant. Despite these characteristics, CLNX trades at only 14x EV/EBITDA which is significantly below US peers and recent private market transactions. For example, Infratil (IFT) recently sold down the remaining stake in its Vodafone NZ tower assets at more than 30x. CLNX’s recurring free cash flow yield is high-single digit and we expect free cash flow to grow over time.
¹ This forecast is based upon Cooper Investors’ current views and assumptions and is not guaranteed to occur. Any forecast may differ materially from the results ultimately achieved.
Regional Exposure
Capital Pools
Market Capitalisation
Since Inception Net Returns in Up/Down Markets
Past performance is not a reliable indicator of future performance
Source: Internal CI data reports, December 31, 2025
Portfolio & Risk Metrics
| Portfolio | Benchmark | |
|---|---|---|
| Price/Earnings | ||
| Yield | ||
| Price/Book | ||
| Net Debt to Equity | ||
| FCF Yield FS | ||
| Forecast Earnings Growth | ||
| Return on Equity | ||
| Tracking Error | ||
| Beta |
Further Information
Looking for further information regarding the Fund, please don’t hesitate to get in touch:
