Performance Summary
Past performance is not a reliable indicator of future performance
Source: Internal CI data reports, December 31, 2025
Inception Date: 4 July 2002
*Annualised
$100k Invested Since Inception (net)
Past performance is not a reliable indicator of future performance
Source: Internal CI data reports, December 31, 2025
Risk/Return Since Inception (Per Annum)
“History Doesn't Repeat Itself, but It Often Rhymes” – Mark Twain
Quarterly Highlights
The ASX200 Accumulation Index returned ‑1.01% for the quarter, marking a weak end to the calendar year in which it returned 10.32%. The portfolio outperformed over the quarter albeit poorer performance earlier in the year remained a drag on the longer term1. Materials/resources were the star performers over both timeframes. During the latter part of this last quarter we saw both resources and banks rally as the yield curve steepened and the USD weakened. Traditional growth sectors were weak across both periods; healthcare and information technology were the two weakest sectors, both down over the calendar year and over the quarter as bond yields rose slightly and mixed earnings reports came through. In healthcare CSL Limited (CSL), Cochlear (COH) and Telix (TLX) were down over both periods, as were Wisetech Global (WTC), Xero (XRO), Technology One (TNE) and Pro Medicus (PME) in the tech sector.
For the portfolio, better performers over the quarter included Light & Wonder (LNW) (transfer of listing completed), Ryman Healthcare (RYM) (signs that the turnaround is progressing and the rate cuts in NZ giving some optimism towards the residential property market) and Orica (ORI) (earnings continuing to improve). The worst performing stocks were Wisetech Global (WTC) (market suspicion over the company’s new commercial model and its impact on revenue growth), Newscorp (NWSLV) (reflecting weakness in realestate.com.au as the rise in interest rates impacted sentiment in the residential property market and the rise of AI is being seen as a threat to property portals) and CSL (a second profit downgrade at the AGM due to ongoing vaccine fatigue in the USA and a slowdown in albumin growth in China).
¹ Past performance is not a reliable indicator of future performance.
Portfolio Insights & Market Observations
Although the US market rose over the year and there seems to be an air of optimism over next year, driven by the likelihood of a further cut in interest rates, there are also confusing signals emerging on the economic front. Recent US macro-economic data point to an economy that is growing in aggregate but fragmenting beneath the surface. Real GDP growth has remained resilient, supported by government spending, business investment, and continued consumption. Yet, labour-market indicators are softening, with unemployment drifting higher and hiring momentum slowing—suggesting that growth is becoming less labour-intensive. At the same time, consumer confidence remains depressed, reflecting elevated cost-of-living pressures, depleted excess savings for many households, and persistent uncertainty about jobs and inflation, even as headline growth looks healthy. This divergence highlights a widening gap between macro output and micro experience.
A key unifying thread is distributional divergence: spending strength is increasingly driven by higher-income households, particularly the top 10%, who benefit from asset-price gains, strong balance sheets, and higher exposure to equity markets. In contrast, middle- and lower-income consumers—more reliant on wages and credit—are cutting discretionary spending, which shows up in uneven demand for retail sales and services. This bifurcation allows GDP to remain firm even as sentiment weakens and unemployment edges up, because a narrower slice of the population is propping up aggregate demand. The result is an economy that looks strong in topline data but fragile in breadth, making it more sensitive to asset-market corrections or further labour-market cooling.
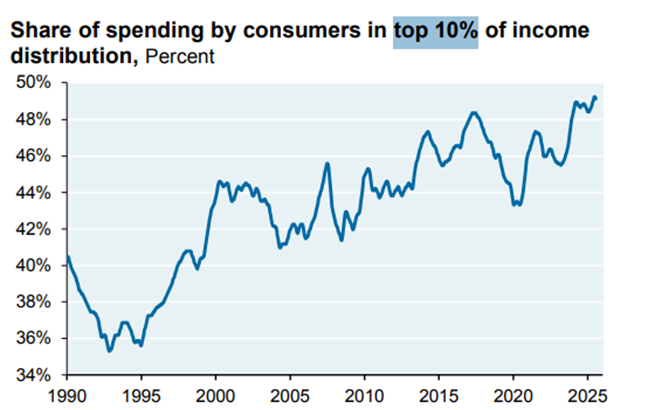
Source: Moodys Analytics, Federal Reserve, Q2 2025
To the above one can add numerous other uncertainties – the size of the budget deficit, the level of government on and off balance sheet debt, trade and tariff issues, sticky inflation, geopolitics and the number of conflicts all over the globe (to which can now be added Venezuela!). These same issues afflict almost all Western countries. The US has proved resilient in the past – it will need to be again!
The advent of AI and its impact has gathered pace over the last two years. As per the quote above, and in our experience, history rarely repeats exactly, but it does rhyme. Based on pattern recognition across both the internet and AI ages, two distinct phases are evident: a front-loaded capex super-cycle in infrastructure, followed later by an application-driven monetisation phase with more scalable margins. The internet era saw low-single-digit trillions of dollars poured into core networks, access (broadband, mobile), and web-scale data centres over roughly two decades, much of it ahead of proven business models. Topline growth for infrastructure and early platform stocks was rapid but often disconnected from durable profitability, with many telcos and dot‑coms overbuilding capacity or overpaying for spectrum and fibre, resulting in low margins. Eventually, value accreted to a relatively small set of platforms (search, social, e-commerce, SaaS) that used this cheap, abundant infrastructure to drive high recurring revenue and strong operating leverage.
The AI age is replaying this with more concentrated, faster capex, centred on hyperscaler data centres, GPUs/AI accelerators, networking and power systems, with estimates pointing to low-to-mid single-digit trillions in cumulative AI-heavy infrastructure spend by around 2030. Near term, this favours “picks‑and‑shovels” names (chips, data centre REITs, power/thermal vendors) whose top line can grow very rapidly as hyperscalers race to secure compute and energy, but whose medium‑term risk is a utilisation or pricing reset if demand lags the build‑out. Red flags to watch include: revenue growth overly dependent on a handful of hyperscaler customers; capex intensity rising faster than gross profit; signs of overcapacity (falling GPU/day pricing, softening AI cloud prices); low margins; business models subsidising users without clear unit economics; and regulatory, power, or data‑access constraints that cap volume growth. As in the post-dot-com period, the more durable winners are likely to be the platforms and AI‑native software firms that can convert the sunk infra into sticky workflows and high-margin recurring revenue, rather than those whose fortunes hinge solely on the continuation of the current capex boom.
As with the internet age, where and to whom value accrues will change over time. While not totally clear today, as per history, it is likely those able to use AI to best effect (rather than those supplying the tools) will be main beneficiaries in the longer term.
Stocks Stories
Banks
At an aggregate level, not much changed in the banks this quarter: valuations remained high, results were resilient and consensus earnings forecasts continued to grind up. This translated to performance that was broadly in-line with the benchmark.
However, beneath the surface, some notable stories emerged. Foremost was the performance of ANZ Group (ANZ), which outperformed the index by more than 13% and peers by 11-15%.
ANZ was much maligned through 2024 and the early part of 2025 given concerns around franchise strength and governance/risk management. However, improving earnings momentum and the allure of a turnaround story proved a compelling mix in the second half. Central to these ambitions is new CEO Nuno Matos’ hope to increase return on tangible equity (ROTE) from 10.3% in FY24 to 12% in FY28 and 13% by FY30. This includes achieving a cost-to-income ratio in the mid-40s by FY28.
Analysts remain sceptical of their ability to simultaneously cuts costs and grow revenue, with virtually no ROTE growth baked in off the normalised FY26 forecast of 10.9% (VA consensus 11.1% ROTE in FY28 and FY30). While we are sympathetic to some of these concerns, the combination of subdued expectations and relatively attractive valuation (15x vs. peers at 18-25x) leaves us more sanguine.
Interestingly, when we look back over the past decade, the best performing major bank has typically been either:
- The one that delivers the best EPS revision trends; and/or
- The one with an attractive transformation story under a new CEO (even if EPS trends are not supportive).
| Year | Best performer | EPS rev. rank | Theme driving performance (green = new CEO) |
| 2015 | WBC | 1 | Strong mortgage growth, NIM expansion. |
| 2016 | ANZ | 4 | Transformation program under new CEO. |
| 2017 | CBA | 1 | Sector-leading revenue growth. |
| 2018 | CBA | 4 | Transformation under new CEO, addressing risk issues. |
| 2019 | CBA | 2 | Transformation under new CEO continues. |
| 2020 | CBA | 1 | Next leg of strategy turns to growth, buybacks. |
| 2021 | NAB | 2 | New Chair & CEO drive sharper focus, supporting EPS. |
| 2022 | WBC | 1 | Cost-out story underpins earnings revisions. |
| 2023 | ANZ | 2 | Restructure of Institutional supports upgrades. |
| 2024 | WBC | 1 | Support for new CEO’s strategy. |
| 2025 | ANZ | 1 | Recent enthusiasm for new management’s strategy. |
As CBA’s experience from 2018-20 shows, a bank can outperform for multiple consecutive years when the set-up is right. Learnings from CBA’s successful turnaround include the importance of:
- No excuses – an authentic recognition of the issues at a root cause level,
- A clear remediation plan,
- Commitment from top-down to execute on it,
- Decisive execution with unwavering commitment, and
- Pivoting once delivered, without compromising the improvements made.
Encouragingly, new CEO Matos appears to be following the same playbook so far. As such, ANZ remains our largest overweight in the banking sector.
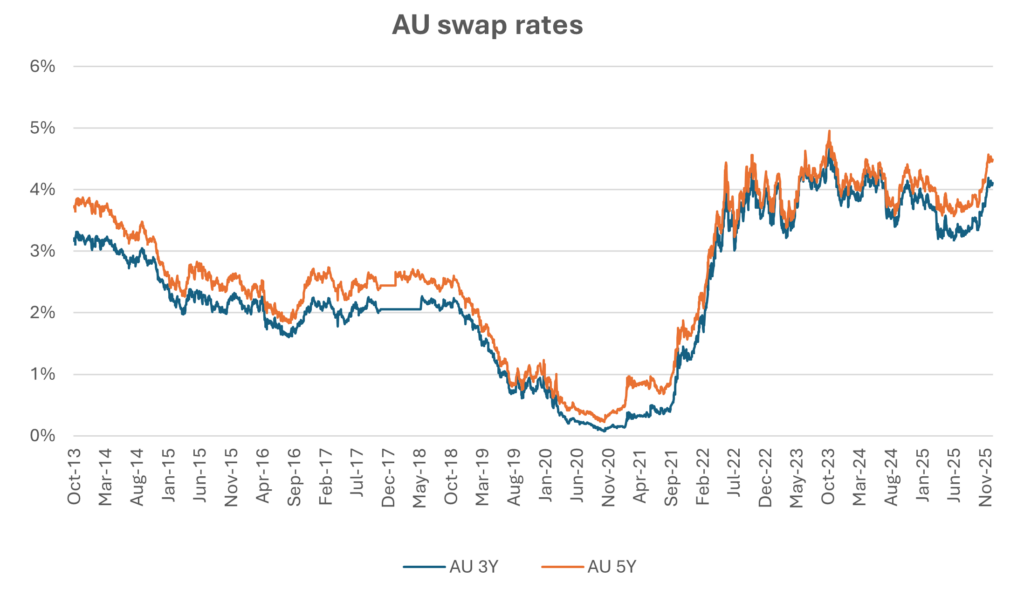
More broadly, the sector staged a strong rally in December outperforming the benchmark by more than 3%. This coincided with a sharp increase in swap rates, which should support net interest margins if sustained. As such, despite stretched valuations, we retain only a moderate sector underweight.
Source: FactSet
Insurance
We are underweight insurance but retain a moderate overweight in QBE Insurance (QBE).
The sector’s previously strong operating trends weakened noticeably in the latter part of the quarter, largely driven by cat-driven downgrades from the domestic insurers.
We do not own Suncorp (SUN) which was particularly hard hit given its exposure to weather-impacted Queensland, underperforming index by over 11%.
QBE Insurance (QBE) held up better, albeit underperforming (-1.9%). As part of its 3Q25 update, QBE reiterated guidance for a 92.5% combined operating ratio (COR) in FY25. There was some concern that core underlying trends had deteriorated given this number is supported by benign catastrophe trends and reserve releases. Management attributed this to the high incidence of ex-cat large losses and significant claims inflation in Accident & Health (A&H).
With A&H largely repriced at the start of each year, large losses likely being one-off in nature, investment yields stabilising, reinsurance tailwinds and a new A$450mn buyback providing support, we remain comfortable with the outlook. After multiple years of rate hardening, moderating pricing growth is a growing concern for the market. QBE has done a commendable job of offsetting this with ex-rate growth (7% ex-exits in FY25 YTD), with optionality still available given the globally diversified nature of the business model. Price adequacy remains strong, which is supporting high-teen returns.
Given this, we believe that QBE remains attractive relative to both insurance peers and the market.
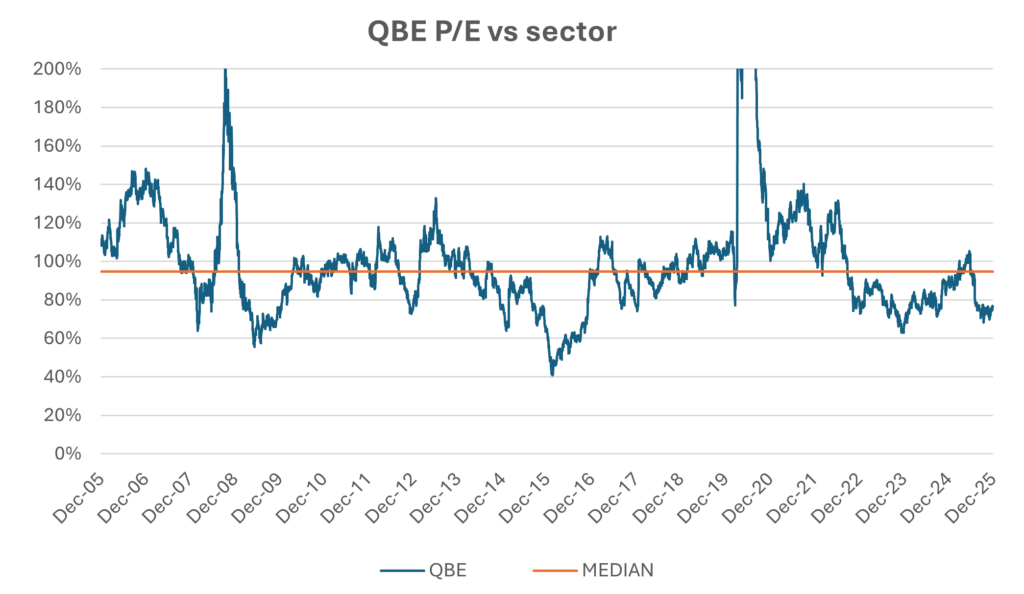
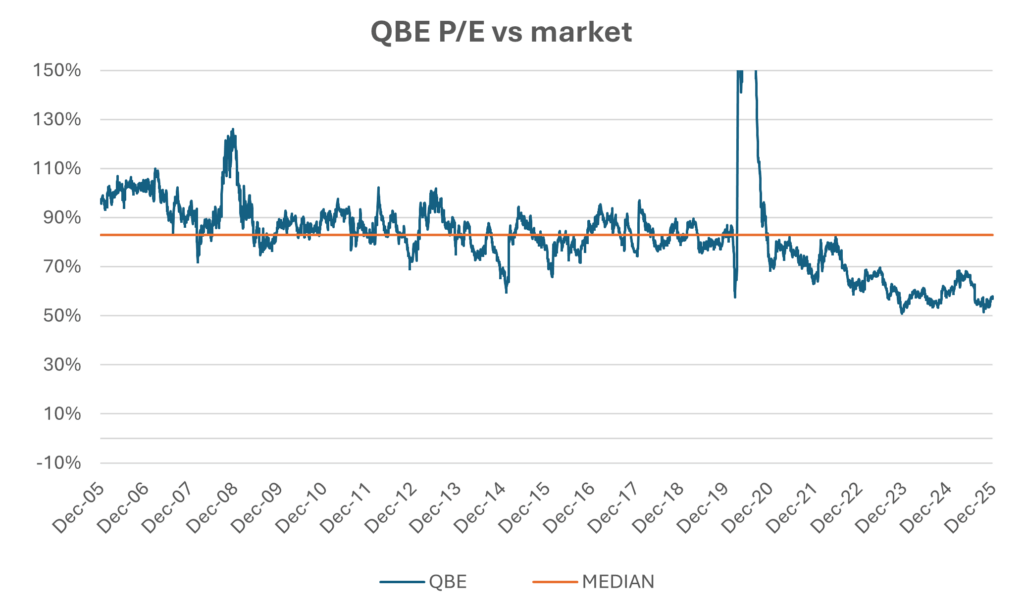
Source: FactSet
Portfolio Snapshot
Past performance is not a reliable indicator of future performance
Source: Internal CI data reports, December 31, 2025
Top 5 Fund Holdings
| name | sector | subset |
|---|---|---|
| BHP Group Ltd | Materials | Cyclicals |
| Commonwealth Bank of Australia | Financials | Stalwarts |
| ANZ Group Holdings Limited | Financials | Stalwarts |
| CSL Limited | Health Care | Stalwarts |
| Ryman Healthcare Ltd. | Health Care | Cyclicals |
Sector Exposure
Subsets of Value
Market Capitalisation
Since Inception Net Returns in Up/Down Markets
Portfolio & Risk Metrics
| Portfolio | Benchmark | |
|---|---|---|
| Price/Earnings | ||
| Yield | ||
| Price/Book | ||
| Net Debt to Equity | ||
| FCF Yield FS | ||
| Forecast Earnings Growth | ||
| Return on Equity | ||
| Tracking Error | ||
| Beta |
Further Information
Looking for further information regarding the Fund, please don’t hesitate to get in touch:
