Performance Summary
Past performance is not a reliable indicator of future performance
Source: Internal CI data reports, March 31, 2026
Inception Date: 1 July 2004
*Annualised
$100k Invested Since Inception (net)
Past performance is not a reliable indicator of future performance
Source: Internal CI data reports, March 31, 2026
Risk/Return Since Inception (Per Annum)
“The mind that is anxious about future events is miserable” - Seneca
Quarterly Highlights
The CI Brunswick Fund returned -10.0% for the March 2026 quarter net of fees and expenses, compared to -1.6% for the ASX200 Accumulation Index. Contributors to portfolio performance in the period were Glencore (GLEN), Karoon (KAR) and Washington Soul Pattinson (SOL). Stocks that underperformed include Ryman Healthcare (RYM), Aspen Group (APZ), and Guzman y Gomez (GYG). For the FYTD (9 months to March 30), the BF has returned -3.8% vs the ASX200 Accumulation Index of +2.0%.¹
¹ Past performance is not a reliable indicator of future performance.
Portfolio Insights & Market Observations
1) hard assets (~33% of portfolio), being property associated with aged care, retirement, hospitals and affordable housing, and infrastructure such as mobile towers.
2) physical products (~36% of portfolio) mostly commodities like iron ore, oil, LNG, gas, copper, lithium, coal, ammonium nitrate, cement, aggregates, plasterboard and insulation, as well as agricultural products like olive oil and almonds.
3) services (~26% of portfolio) such as freight, logistics, warehousing, testing, quick service restaurants, pharmacy retail, banking services, property and lending. In addition, this category includes diversified holding companies and the media and data businesses owned by Newscorp (NWS).
² Past performance is not a reliable indicator of future performance.
Stock in Focus
Cobram Estate (CBO)
Late in 2025, portfolio stock Cobram Estates (CBO) acquired US-based California Olive Ranch (COR). We are excited by this acquisition and see opportunity for CBO to grow its business in the US. In short, a highly experienced management team has acquired a unique local brand and quality set of assets that had not been optimised to its potential. The combination will see CBO become the #3 player in the high value extra virgin olive oil category in the US.
CBO sits in our real assets and income securities capital pool given its extensive land holdings/assets including trees and irrigation infrastructure, not all of which is productive at present. We recently visited both existing Cobram assets and the newly acquired assets which stretch Sacramento (Woodland for the CBO assets) to Chico (COR assets). The area is rich in walnuts, almonds, grapes, and olive groves among other crops.
The area is irrigated mainly from underground sources. Regulators have stepped in to limit the amount of water taken from these underground sources in recent years as these underground water levels had been falling. Olives use substantially less water than almonds and slightly less than vineyards. Given a glut of grapes and falling demand for wine, many vineyards have recently become unprofitable. CBO has been able to buy vineyards below land value (effectively accounting for conversion costs), while still utilising some of the infrastructure given similarities of growing techniques.
CBO dominates the Australian extra virgin olive oil (EVOO) segment. This is the premium category of oils because the oil tastes better and is the only olive oil that is good for you. The health benefits of EVOO have been well established. CBO's initial foray into the US was organic, taking the Cobram brand and acquiring its own land/groves and as well as sourcing deals with third party growers, a more capital light approach.
We believe the long-term opportunity for CBO in the US is large given olive oil remains a nascent category. Per capita, Australians consume 2x the EVOO vs the US. In Spain and Italy, the consumption is more like 10x (vs the broader olive oil category). The US population consumes far more of the unhealthy seed oils. In Spain and Italy, growers are mostly small farms with co-ops running milling and branding, and growers there are favoured by subsidies.
Our visit made obvious the multiple synergies for CBO from the COR deal
- Cost: combining two mid-sized producers/brands into a top 3 player will deliver scale benefits and cost out. Near term this will be overhead/people related as well as via closing one of the bottling plants.
- Yield: CBO's groves are at 2-3x the yield of CORs. This is a function of simple practices that CBO has mastered over the last 20 years.
- Portfolio value: CBO can put some of its Australian Oil into COR brands that currently receive much higher prices, yet currently using Oil imported from Italy/Spain.
- Brand: combined resource will aid brand spend, channel negotiations etc.
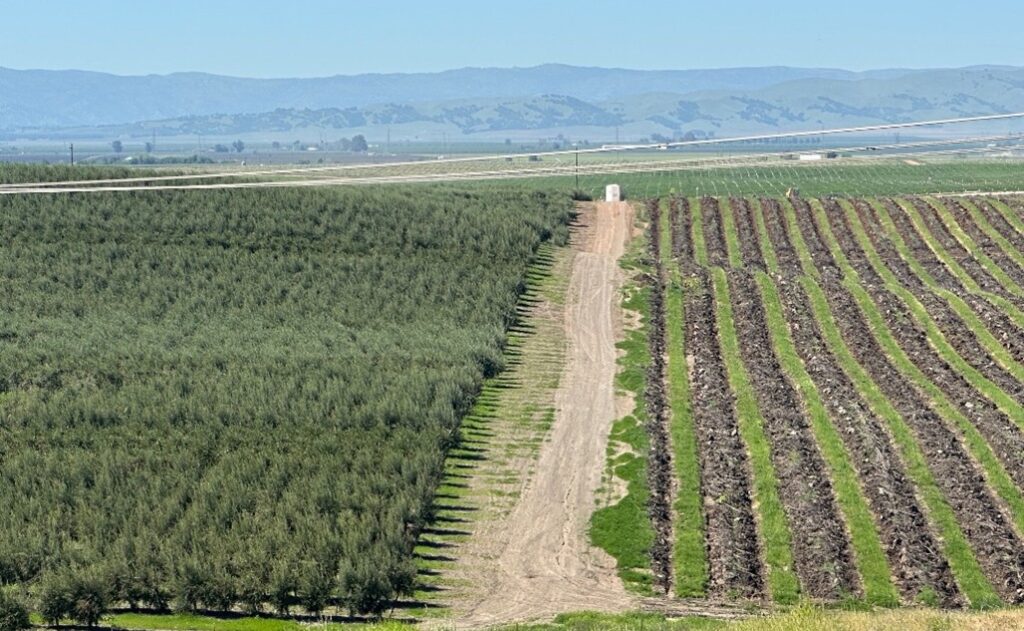
Olive groves on the left, vineyard that has been pulled out on the right (note: CBO acreage goes all the way to the top of the first set of hills in the background).
Trip Notes
During the quarter we travelled to New Zealand with a focus on Ryman (RYM). We also spent two weeks in the US focused on portfolio stocks (NWS and CBO per above), AI and Energy companies.
Ryman (RYM)
We attended the RYM investor day and spent time meeting with peers and related companies.
In short:
- Market trends remain relatively subdued and RYM continues to work through excess inventory however there are early signs of greenshoots.
- Private equity players (Stonepeak) are running materially higher debt vs listed players. RYM’s debt levels are materially below both these private players and listed players, which points to value latency medium term.
- Head office costs are still high at RYM vs peers (particularly private peers) – we remain focused engaging with Board and management on these issues.
Newscorp (NWS)
Newscorp hosted an investor day in New York to showcase its Dow Jones (“DJ”) business, with multiple presentations across business lines. DJ set a 5-year $1bn EBITDA target (currently ~$550m) with the bridge from current EBITDA being:
- Strong growth from Energy and Risk ~ both are currently growing EBITDA mid/high teens.
- WSJ consumer pricing ~ currently underpriced vs FT given strong brand position.
- Enterprise growth, a much higher margin business.
- Cost control/efficiency (+4% cost growth vs +7% revenue growth last 8 years drove mid-teens EBITDA).
We continue to see significant value latency. At present, NWS ex REA has an Enterprise Value of $4.5bn with ~$1bn of EBITDA with a runway to grow this to $1.5-$1.7bn EBITDA over the next 5 years.³
AI meetings
- In San Francisco, the agentic revolution is all consuming. The worker of the future will likely be leveraging many agents to do work that was previously done by humans.
- The current accepted use cases are:
- Programmers - the common quote was programmers are now 5-10x more productive. The world for programmers has changed. You are now managing agents programming for you.
- Sales force/customer service
- Research
- Admin
- However, it is likely to be far more pervasive than the above.
- The LLMs are very capital intensive and are likely scale businesses (first movers win). The profit pool required to support their capital intensity/investment comes from corporates and consumers paying for efficiency savings. The underlying source of this on the corporate side is less people and perhaps medium-term higher productivity (selling more with same people/costs).
- OpenAI and Anthropic (and maybe Gemini) are in an accelerated race to win corporate/enterprise. Anthropic has chosen to focus on enterprise.
- To build an agentic business/app/process, it requires (1) the LLM + (2) company specific data + (3) business practices/processes.
- As an example, a customer service agent utilises the LLM to converse with the customer, but needs the data the company has on the customer and it needs to know the policies for how to proceed/answer questions or resolve the issue.
- The role of incumbents versus new ‘agentic-native’ players and the LLMs is rapidly evolving. Will this eventually lead to many incumbent players being pushed out?
- We are moving from a world where single products were built based on scale for many customers (office, salesforce etc), to one where you can build your own highly customised product at low cost.
- LLMs pricing model is based on token use. The LLMs have become more sophisticated in how this is charged.
- Early adopters within enterprises want employees to be high users of tokens, even if that means spending a lot.
- Bottlenecks/areas of scarcity continues to be data centres, power, chips and memory. The rollout of inference capacity at the DC level was debated. The demand side is linked to corporate/consumer take-up which is unclear. It could be huge and quick.
- There is a bullish case for metals/commodities longer term if this buildout continues at pace, combined with the rollout of physical AI, e.g. robots - aluminium, copper, steel, and rare earths are all important inputs.
- The US energy sector is in good shape.
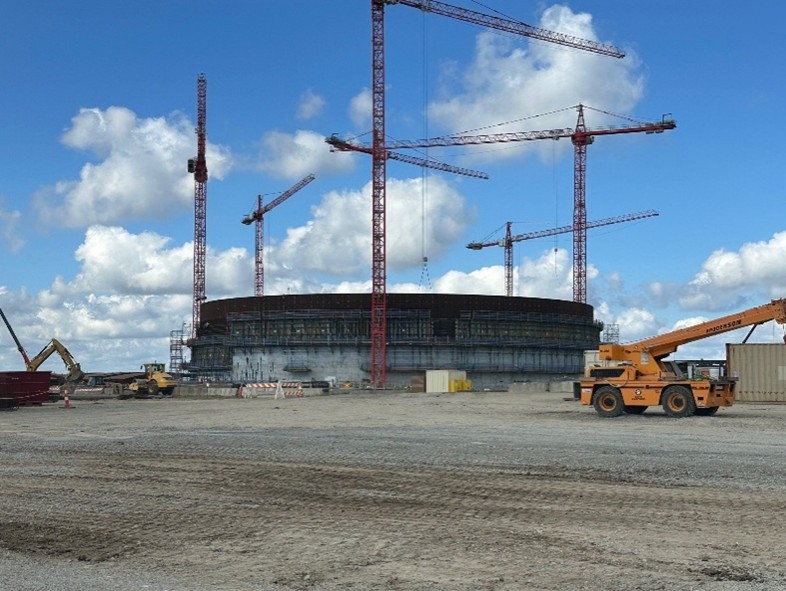
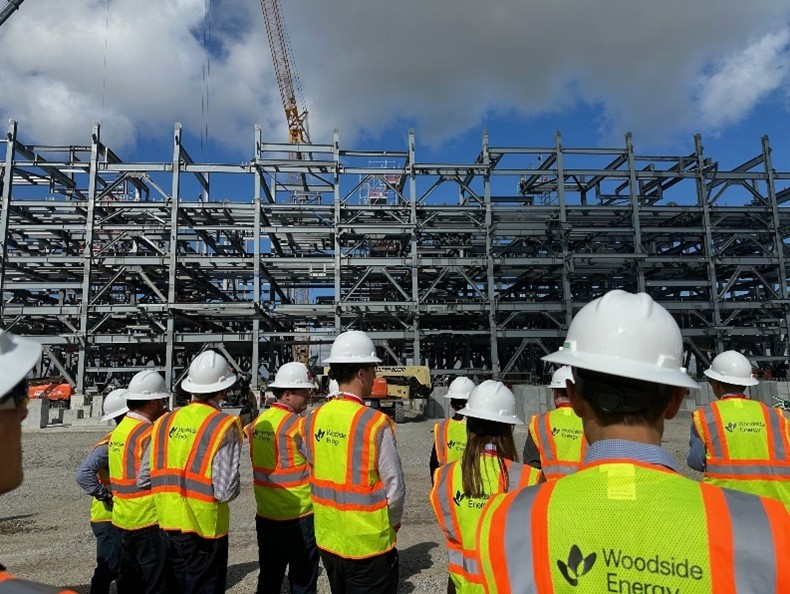
- We visited Woodside’s “in-construction” Louisiana LNG site. The scale of the site is significant and will provide much needed new volume to the global LNG market. WDS still needs to source additional project partners, offtake contracts and upstream gas, and ensure Bechtel delivers the project as close to on time and budget as possible.
- WDS' blue ammonia plant at Beaumont also well placed having just come online into a strong pricing environment.
- The rig/drillship market remains of interest with industry assets falling by half over the last 10 years and the acquisition of Valaris (VAL) by Transocean (RIG) currently in review by 8/9 jurisdictions globally. Given it takes ~7 years to build a new drill ship, we believe the supply /demand setup looks favourable going forward.
- A fairly common view is many US shale fields are facing accelerating decline rates (Appalachian is one exception due to pipeline capacity bottleneck). However, the counter is the industry continues to find ways to extend production via technology, perhaps AI has a role.
LLNG: construction of the massive storage tanks on the left, the LNG trains on the right
Regional Exposure
Capital Pools
Market Capitalisation
Since Inception Net Returns in Up/Down Markets
Past performance is not a reliable indicator of future performance
Source: Internal CI data reports, March 31, 2026
Portfolio & Risk Metrics
| Portfolio | Benchmark | |
|---|---|---|
| Price/Earnings | ||
| Yield | ||
| Price/Book | ||
| Net Debt to Equity | ||
| FCF Yield FS | ||
| Forecast Earnings Growth | ||
| Return on Equity | ||
| Tracking Error | ||
| Beta |
Further Information
Looking for further information regarding the Fund, please don’t hesitate to get in touch: