
Performance Summary
Past performance is not a reliable indicator of future performance
Source: Internal CI data reports, June 30, 2026
Inception Date: 5 December 2016
*Annualised
$100k Invested Since Inception (net)
Past performance is not a reliable indicator of future performance
Source: Internal CI data reports, June 30, 2026
Risk/Return Since Inception (Per Annum)
Quarterly Highlights
- The Strategy returned 3.6% for the quarter.1
- The top performers were TSMC (2330-TW), Canadian National Railway (CNR) and Power Corp (POW).
- The detractors to performance were CME Group (CME), Franco Nevada (FNV) and Nintendo (7974).
- The Strategy returned -0.5% in AUD for the FY26 year and, in local currency, was up ~8% for the FY26 year.1
- Since inception, the Strategy has generated 8.0% p.a. return.
¹ Past performance is not a reliable indicator of future performance.
Portfolio Insights & Market Observations
Markets rallied following the de-escalation of the Iran war and the increasingly rapid development of AI. For the June quarter, the main driver of the lag versus the benchmark return was the market being powered by semiconductor and AI-related exposures. The below chart from Apollo shows the calendar year-to-date performance of the S&P 500 being entirely driven by AI and energy.
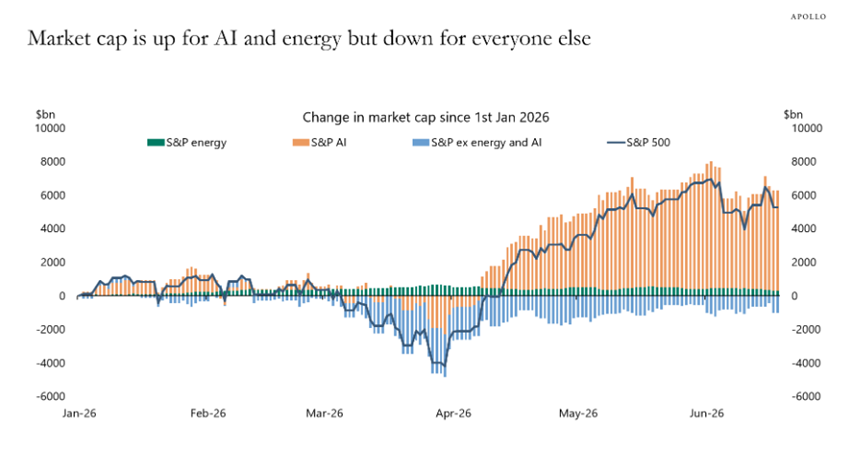
Source: Apollo
The Fund’s largest holding is TSMC (6% of portfolio), which was up 37% in local currency during the quarter. So too, several holdings with direct or indirect AI exposures also benefitted, including Investor AB (INVE.B), from the strong performance of its holdings in ABB and Atlas Copco (ATCO), and Aker ASA (AKER), whose investment in AI cloud provider Nscale contributed positively.
This paled in comparison to the semiconductor index, however, which, as seen by the SOXX, was up 95% for the quarter. Micron Technology (MU) is now a $1.4trn company having risen 214% in the quarter. In fact, many component companies exposed to this thematic have seen their shares bid up to lofty multiples.
We maintain the large TSMC position as it is well placed in an uncertain world, given the business is tied to semiconductor production, as opposed to the capex cycle. In addition, its competitive position is strong and it is difficult to see TSMC being challenged anytime soon, while the large chip providers are in increasingly competitive environments with their hyperscale customers trying to do more and more themselves.
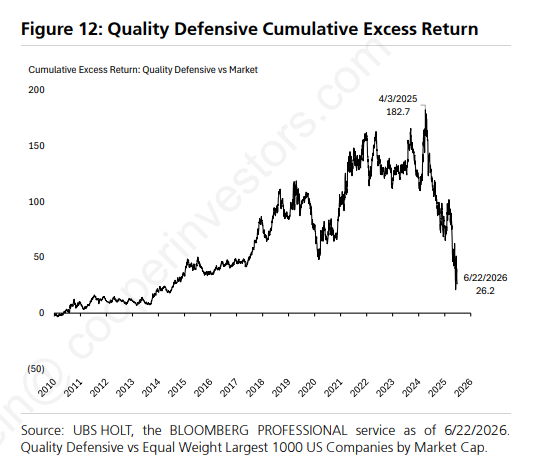
In a world of AI-led growth opportunities, quality predictable businesses continue to be unloved. The below chart from UBS Holt shows the underperformance of quality defensives over the last two years, having nearly handed back the strong outperformance since 2010.
CME, as an example, fell for the quarter and is on its lowest PE in a decade despite increasingly positive trends in the business. It now trades on a greater than 5% dividend yield.
S&P Global (SPGI) is another where the trends of the growth in capex and capital markets will play into top line opportunities. Large companies are raising significant levels of debt, which will be rated by the big rating agencies such as S&P, on which they will clip the ticket. They are trading below market for the first time since the financial crisis, yet the trends are very different to back then!
The Fund has an attractive outlook as per the below stats. With strong expectations and diversity in the portfolio. There is strong conviction in the Fund’s ability to execute on its mandate to generate long-term equity-like returns with less volatility and better downside capture.
| Cooper Investors Global Endowment Fund | Metrics |
| Return on Equity | 23% |
| Sales growth 1Y | 13.3% |
| Earnings growth 1Y | 16.8% |
| Dividend yield | 2.0% |
| Net Debt to EBITDA | 1.0 |
| Price to Earnings NTM | 18.3 |
| Number of stocks | 33 |
Portfolio Snapshot
Past performance is not a reliable indicator of future performance
Source: Internal CI data reports, June 30, 2026
"Bad Request"
Regional Exposure
Subsets of Value
Market Capitalisation
Since Inception Net Returns in Up/Down Markets
Portfolio & Risk Metrics
| Portfolio | Benchmark | |
|---|---|---|
| Price/Earnings | ||
| Yield | ||
| Price/Book | ||
| Net Debt to Equity | ||
| FCF Yield FS | ||
| Forecast Earnings Growth | ||
| Return on Equity | ||
| Tracking Error | ||
| Beta |
Further Information
Looking for further information regarding the Fund, please don’t hesitate to get in touch: